
Screenshots: BlueUPALM
Screenshot gallery of the BlueUPALM frontend, the anti-money laundering analysis and detection platform. The design follows the BlueUP Dark Glassmorphism visual system: dark canvas, glass surfaces with backdrop-blur, blue→violet gradients, and micro-animations.
Login
Access screen with entity selection and Windows domain authentication.
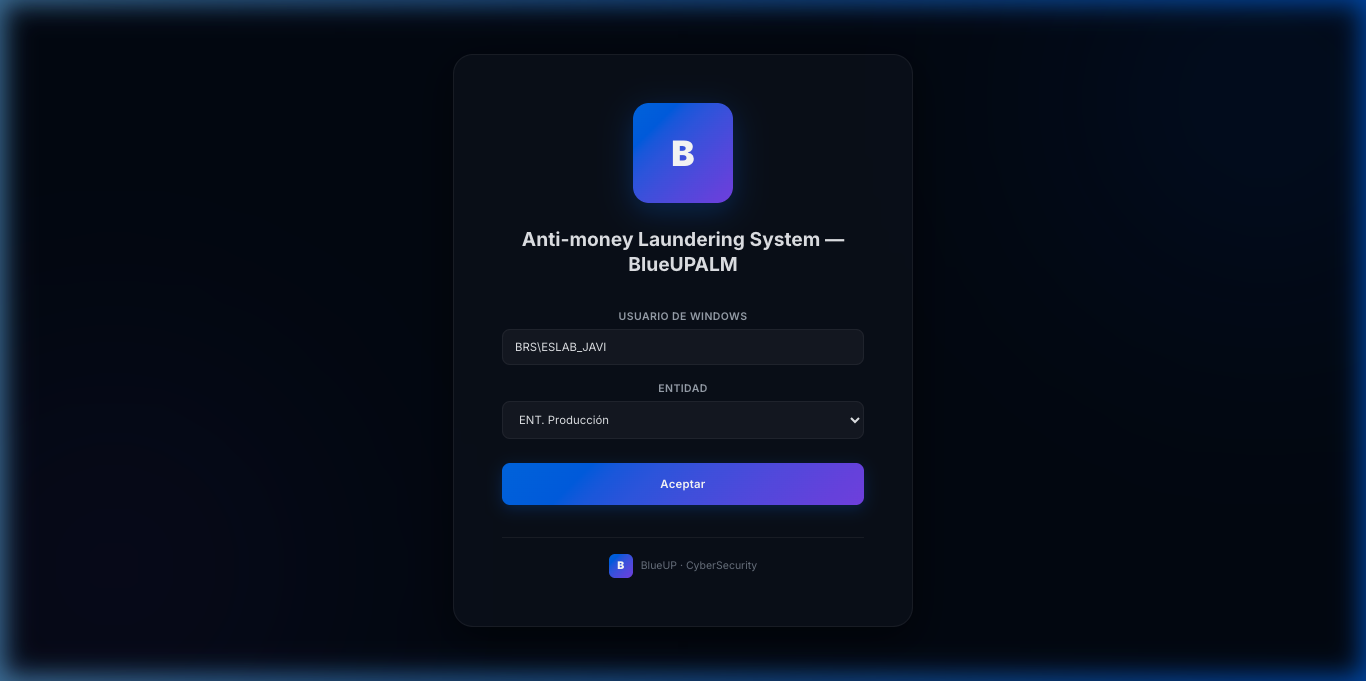
- Glass card with
backdrop-filter: blur(20px)and subtle border - Animated decorative orbs (blue and violet) with
animation: float 8s infinite - Primary button with gradient
#2563eb → #7c3aed - BlueUP branding in footer
Main Dashboard
Main view with operational KPIs and Anti-Money Laundering: prevención de blanqueo de capitales. Consume 5-10% del presupuesto operativo de una entidad media; los sistemas tradicionales generan >95% falsos positivos. Leer más → AML alert visual analytics.
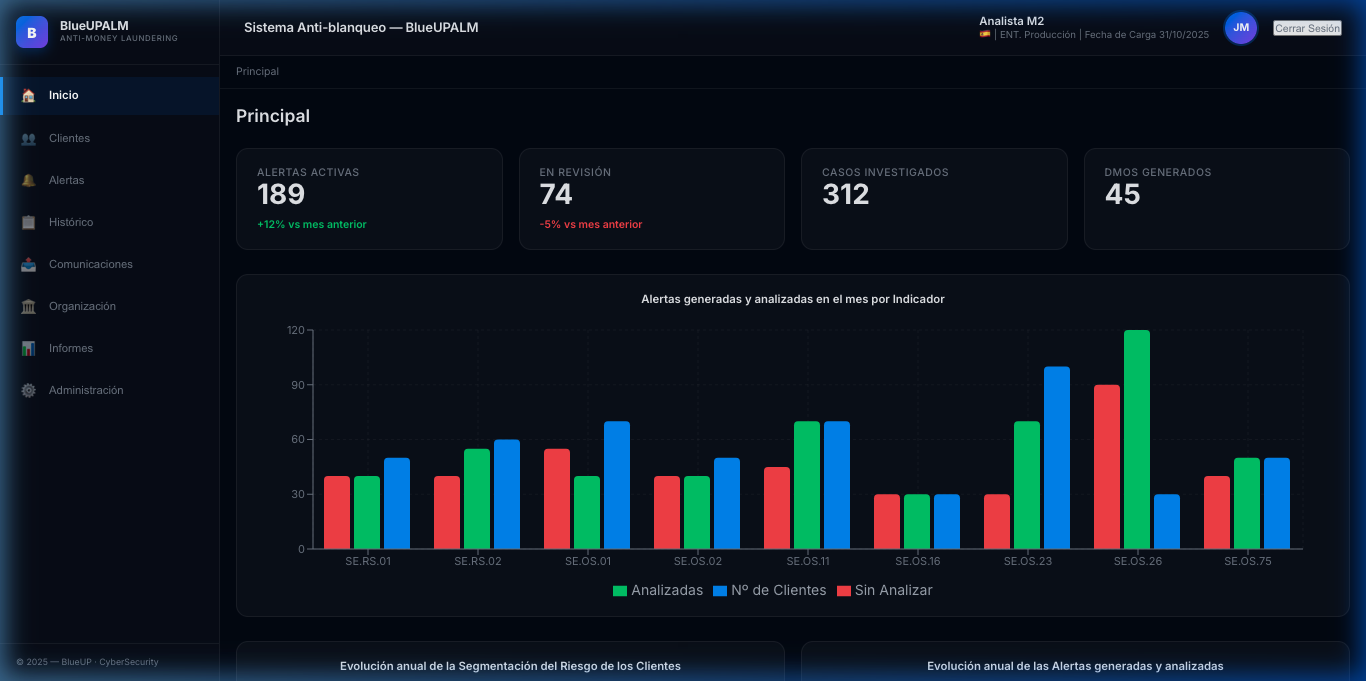
- 4 KPI cards with hover glow and trend indicators
- Alerts by Indicator — grouped bar chart (Recharts)
- Risk Segmentation Evolution — stacked area (High/Medium/Low)
- Alert Evolution — line chart with dots
Clients: Risk Profiles
High-density data grid with client risk profiles, classified by segment.
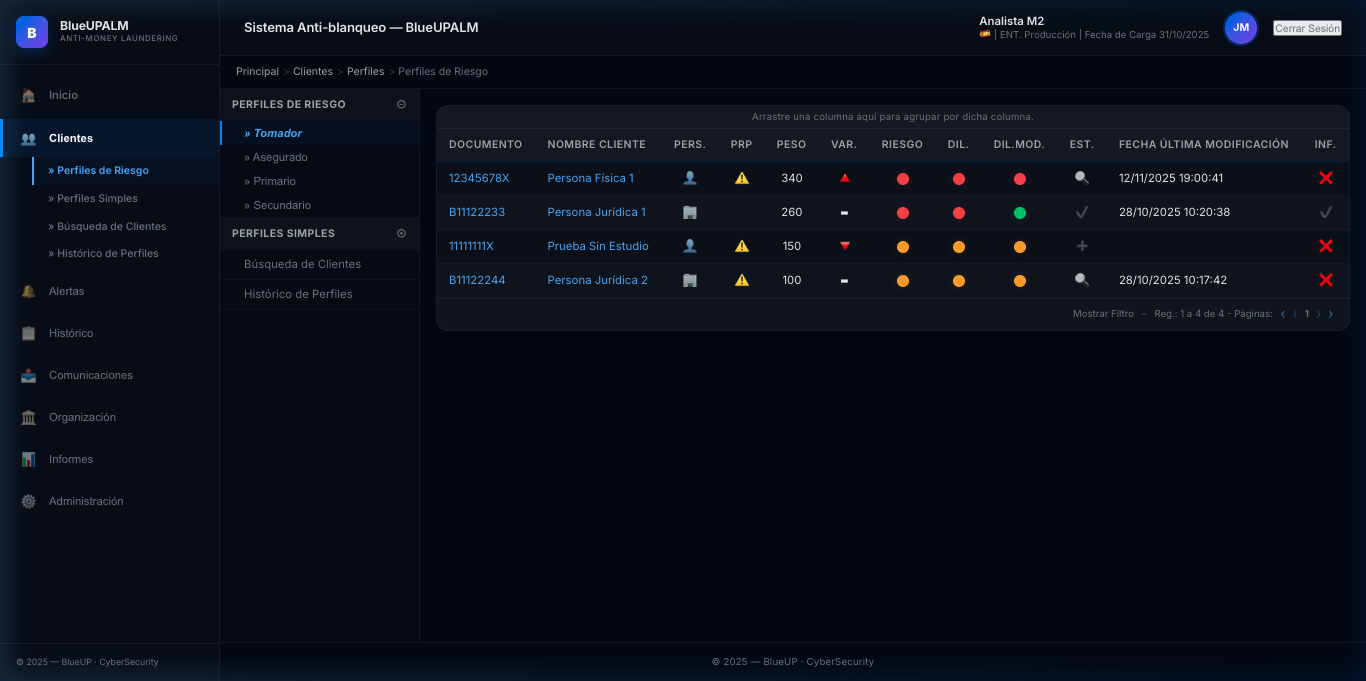
- Sidebar with hierarchical navigation (Policyholder, Insured, Primary, Secondary)
- Risk dots with semantic colors (🔴 High, 🟠 Medium, 🟢 Low)
- Status, diligence, and weight variation indicators
- Data grid with glass headers and blue hover states
Alerts: Dashboard
Alert distribution by area and comparative analysis.
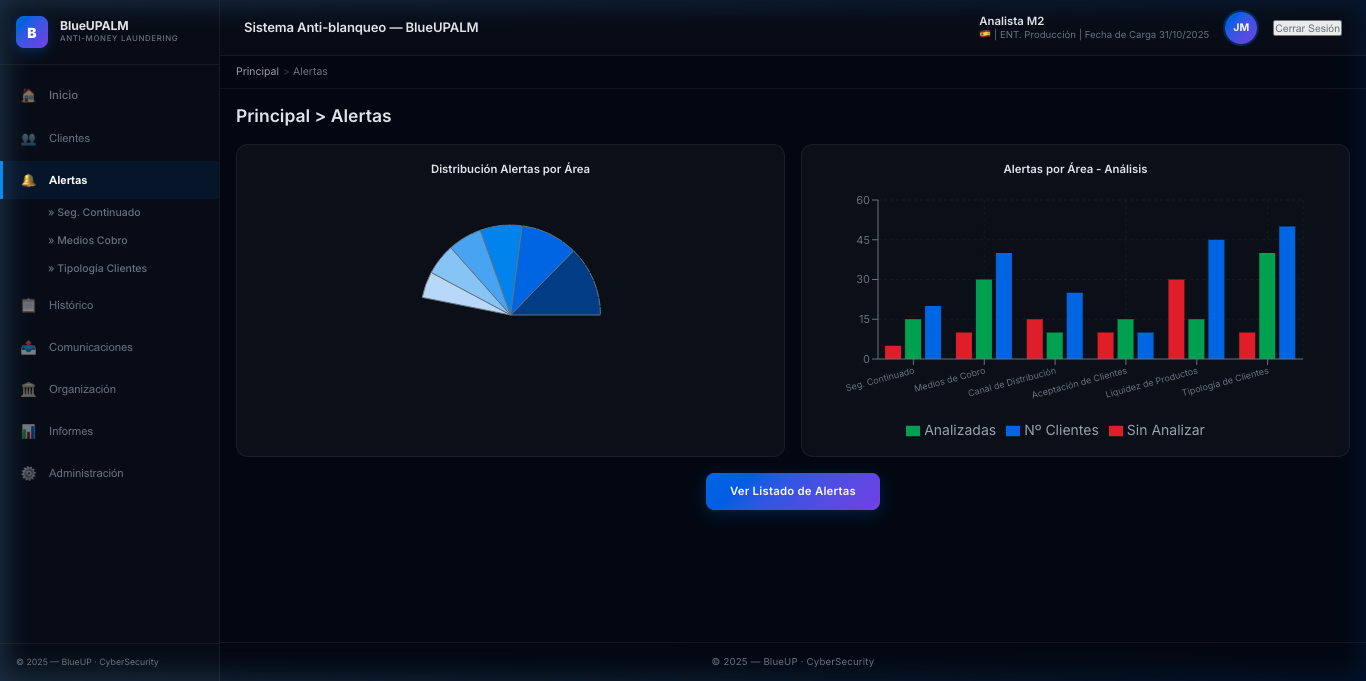
- Distribution by Area — pie chart (Continuous Monitoring, Payment Methods, Client Typology)
- Alerts by Area - Analysis — grouped bars (Analyzed vs Unanalyzed vs Client Count)
- Gradient CTA button for detailed listing access
SEPBLAC Communications
Operational dashboard for communications to the Executive Service.
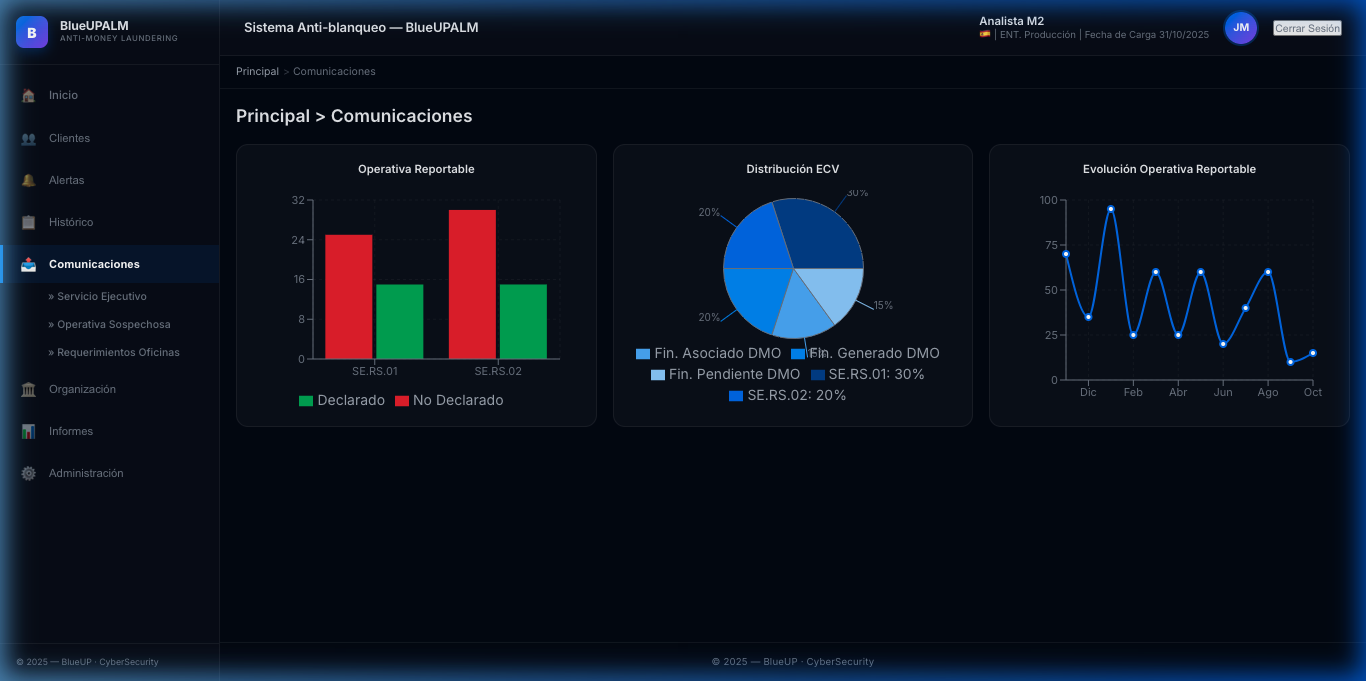
- Reportable Operations — comparative bars by indicator
- ECV Distribution — pie chart with proportions (Associated DMO, Generated, Pending)
- Reportable Operations Evolution — timeline with dots
Administration: Indicators
Master table of entity-configurable alert indicators.
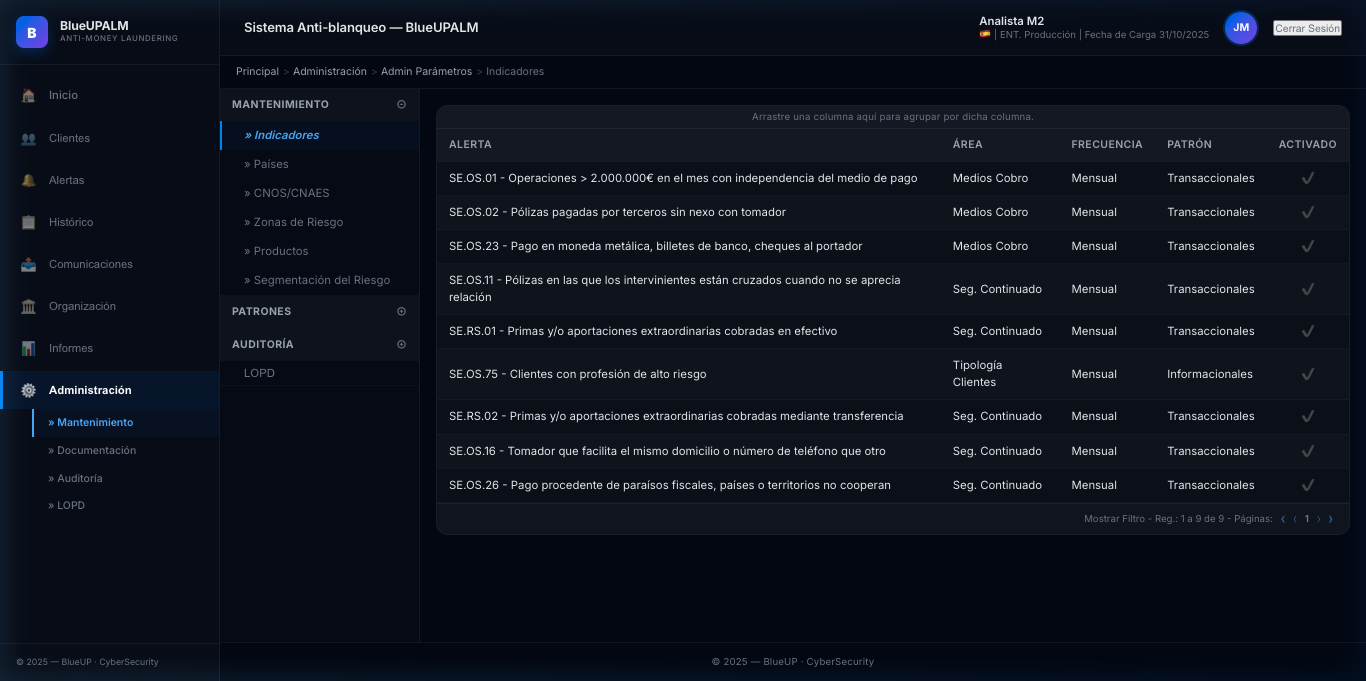
- 9 Servicio Ejecutivo de la Comisión de Prevención del Blanqueo de Capitales e Infracciones Monetarias. Unidad de inteligencia financiera de España (FIU), receptor oficial de las comunicaciones de operativa sospechosa de las entidades obligadas.SEPBLAC indicators with area, frequency, and pattern
- Collapsible admin sidebar sections
- Entity activation checkmarks
- Integrated pagination and filters
Visual Design
The frontend is built with:
| Component | Technology |
|---|---|
| Framework | React 19 + Vite |
| Routing | react-router-dom v7 |
| Charts | Recharts |
| Styling | Vanilla CSS (design tokens) |
| Font | Inter (Google Fonts) |
| Design System | BlueUP Dark Glassmorphism |
Key Design Tokens
| Token | Value | Usage |
|---|---|---|
--canvas | #030712 | Main background |
--glass-surface | rgba(255,255,255,0.03) | Glass surfaces |
--glass-border | rgba(255,255,255,0.06) | Subtle borders |
--brand-gradient | #2563eb → #7c3aed | Primary gradient |
--risk-high | #ef4444 | High risk |
--risk-medium | #f59e0b | Medium risk |
--risk-low | #22c55e | Low risk |